
Teachers are constantly monitoring and adapting based on students’ understanding. They intuitively ask follow-up questions, provide additional practice, and work with small groups to target specific skills. They re-teach concepts that didn’t work on the first (or second, or third) try. Using both formative and summative assessments, educators continuously capture insightful information about students' past and present learning.
Data-driven instruction can transform classrooms, allowing teachers to respond to each child’s needs with more relevant instruction. Data helps teachers and administrators monitor levels of understanding and adjust as needed to encourage student achievement, improve teaching practices, and refine curriculum or goals. Data also creates a “more supportive and constructive school culture” where students and teachers feel encouraged to succeed.
Reflex Data Reports
ExploreLearning Reflex, the most effective system for mastering basic facts, includes powerful reporting features to help teachers, schools, and districts monitor student usage and progress and celebrate achievements.
As students work on Reflex, the program monitors usage and fact fluency progress. Reflex data is available every 24 hours through individual and classroom reports. Individual reports provide student-level data, and group reports summarize classroom performance.
Individual Reports
Overview:
This individual report provides a snapshot of the student’s progress. It includes school year stats for total days of usage, total facts gained, percentage of facts gained, and percentage of Green Light usage. It also shows the last login time and the last seven days of usage.
Fact Detail:
This report shows which facts a student knows and doesn’t know (available in a fact family pyramid and a traditional “fact grid” format). Teachers can change the date range to see how a student’s fluency has changed over time.
Milestones:
This report shows an individual student’s milestones (such as total facts solved). Each milestone can be printed or downloaded as a certificate. All milestones are calculated from the beginning of the school year.
Usage Detail:
This report displays a student's Reflex session, duration, and Green Light status. Statistics on total days of usage, percentage of Green Light sessions, average weekly use and minutes per day, and total facts solved are available. Educators can also change the date range to observe usage.
Fluency Growth:
This report visually represents a student’s progress toward fluency during a given date range. A graph shows fluency gained for the total number of fluent facts over time. Teachers can also superimpose usage data on the fluency data and adjust the date range.
Group Reports
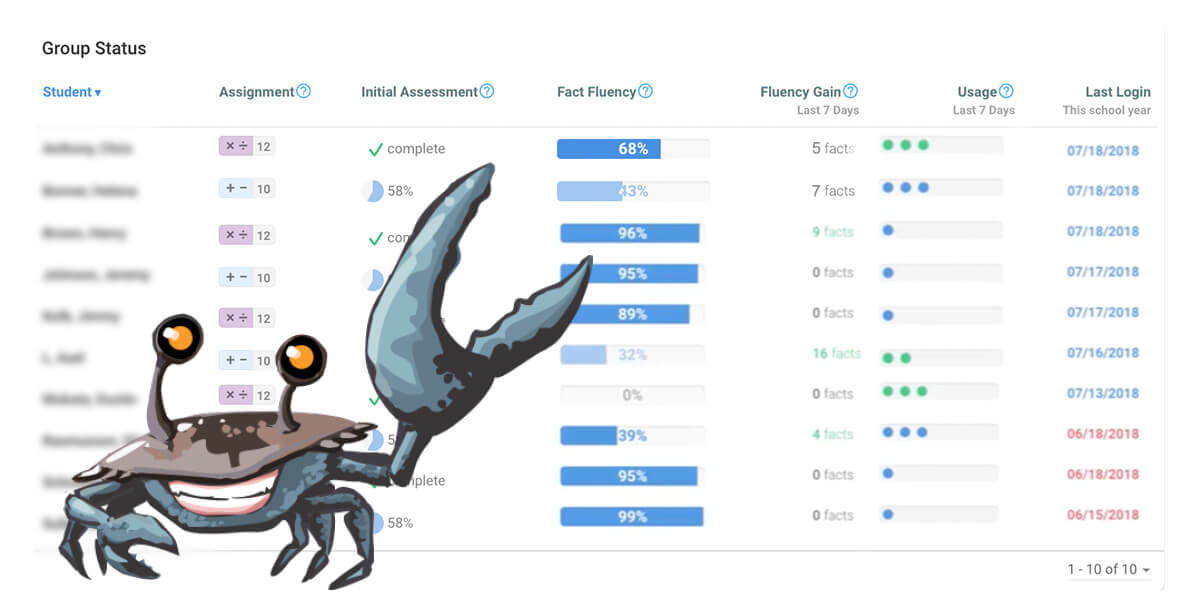
Group Status:
This chart gives information on the status of the initial assessment, percent facts fluent, fluency gain and usage in the last seven days, and date of last login.
Usage Summary:
This group report shares statistics on usage, including average use, percentage of usage days that result in a Green Light, and total facts solved. A second chart shows the average weekly gain in facts for various frequencies of usage. A pie chart breaks down the number of students in different usage categories.
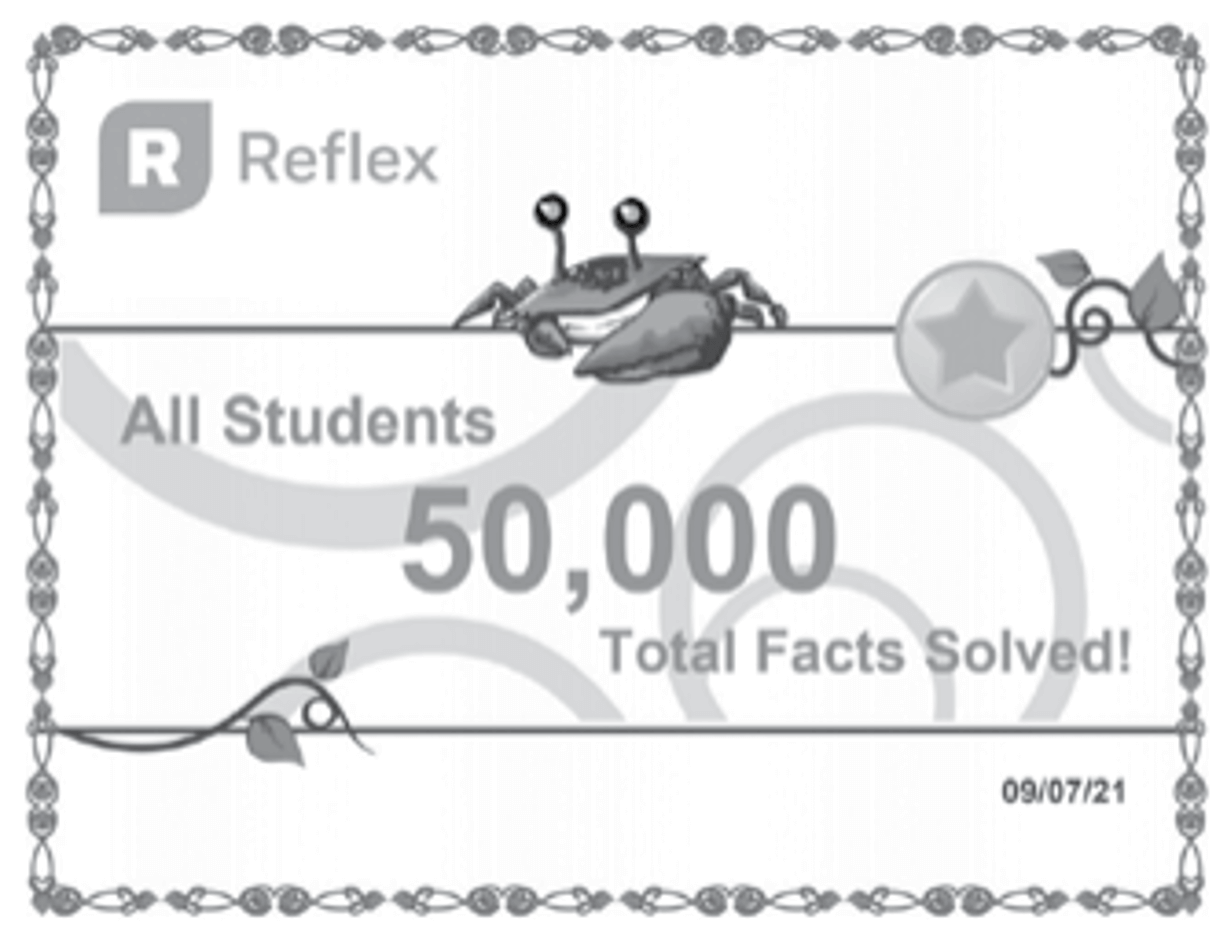
Milestones:
This report provides lists of group milestones (such as total facts solved by all the students in the school) and individual milestones. Group milestones can be listed for the school or by individual grade levels. Teachers can print milestones on certificates. All milestones are calculated from the beginning of the school year only.
Fluency Growth:
This graph shows the number of fluent facts gained or the total number over time. Educators can also superimpose usage data on the fluency data. There are also statistics on the total number of students, total fluency gain, average student gain, average total usage, and percentage of Green Light sessions. Graphs are available as line charts, bar graphs, pie charts, or histograms.
Yearly Data Reset
Group data resets at the beginning of every school year. You can confirm the exact reset date with your Reflex administrator or find the “Start of School Year” date in the Profile/Schools tab.
Before that reset date, we recommend printing off your current group reports, including usage, milestones, and fluency growth, as they will not be available after the reset. (Note: Individual student usage reports will not be reset.)
Summer Reflex Practice
Encourage fact fluency practice over the summer with Reflex. Students can avoid the “summer slide” and come ready to tackle higher-level math problems in the fall!
Students can access Reflex over the summer with the same log-in they used during the school year. Ensure the following for successful student access:
- Teachers should not remove students from Reflex classes or delete Reflex classes at the end of the school year.
- Site administrators should wait to update student master list(s) until students return to school.
Track and Reward Reflex Usage
Reflex data helps teachers and administrators celebrate students’ fact fluency milestones, effort, and progress.
Bulletin boards are an easy way to highlight student fluency growth, promote usage, and build campus excitement around math fact fluency. Visual displays in classrooms or school hallways can celebrate individual and group milestones, including new fluent facts, total facts solved, fluency levels, and growth percentages.
Using Reflex, students work to achieve their daily Green Light goals. The Green Light, located in the upper right corner of the screen, illuminates once a student answers a certain number of facts correctly. Teachers can use the Green Light Tracker to motivate and reward fact fluency progress, along with Green Light bulletin boards and celebrations.
Teachers can also use data from Reflex to celebrate student progress. Milestone certificates are a great way to recognize student achievements.
Experience the power of Reflex data!